|
|
|
|
Welcome to Petroleum Geology Forums
This is a free online community that aims to bring petroleum professionals and geologists together and share valuable knowledge. Registration is easy so become a member now for instant free access.
- Petroleum Geologists can stay up to date with industry related topics and exchange ideas and concepts.
- Upstream Oil and Gas Consultants get a chance to share their expertise and gain exposure to land future projects.
- Geology students and graduates can join the discussion and get into contact with potential future employees.
|
|
|
Hydrocarbon Characteristics of Source Rocks in Loperot-1 Well, NW Kenya
Bernard Kipsang Rop, Ph.D. (Reg. Geol.)
Geofountain Synergy Consultancy
P.O. Box 7702 – 00200, Nairobi, Kenya.
posted online: August 22nd, 2011
ABSTRACT: The hydrocarbon potential of the subsurface Tertiary sedimentary rock sequences of Lokichar basin (NW-Kenya), which has been interpreted using some selective geochemical analysis of rock samples in Loperot-1 Well (denoted as LT-1 Well) for their total organic carbon (TOC) and other sedimentological parameters, form the premise of this research work. Understanding the subsurface structures and depositional environments conducive for hydrocarbon generation and trapping is essential as it forms the basis for exploration. The organic matter richness, facies type and degree of thermal alteration and/or maturation are factors useful in evaluating the potential source rocks. Rock-Eval pyrolysis has been employed on selected rock samples with high TOC for quantification of data, and this would help in precise identification of phases of hydrocarbon generation.
Key Words: Lokichar basin, sedimentary rock, hydrocarbons, exploration, source rocks.
Author:male; PhD; main research fields: Hydrocarbons and Environmental Reduction and Risk Management; Department of Mining and Mineral Processing Engineering, Jomo Kenyatta University of Agriculture and Technology, Taita Taveta Campus, Private Bag, Voi, Kenya.
 |
Introduction
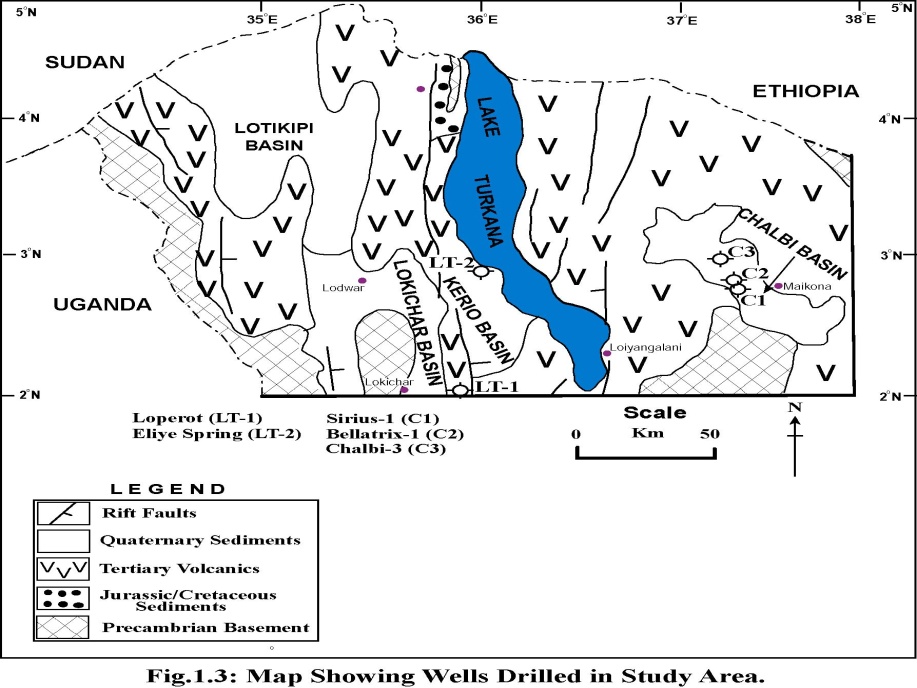
Bounded between longitudes 35°30’E and 36°20’E and latitudes 2°00’N and 3°30’N, the Lokichar basin is segmented as part of the N-S-trending Tertiary Kenya Rift belonging to the great East African Rift caused by the E-W extensional rift tectonics. This basin system is located in the northwest Kenya; to the southwest of Lake Turkana and southeast of Lotikipi basin (Fig. 1). Its geology has lately drawn great attention to geologists despite the paucity of surface exposures due thick cover of Tertiary volcanic lavas and alluvial sediments deposited by the fluvial system constituted by the two major perennial river systems namely, Turkwell and Kerio Rivers [1]. These rivers, flowing from south to north, drain the western high-relief Precambrian basement ranges and volcanic plateaus.
Fig. 1 Map Showing Drilled Wells in NW Kenya Rift Basins
The hydrocarbon potential of the subsurface Tertiary sedimentary rock sequences of the Lokichar basin has been interpreted using some selective geochemical analysis of rock samples in the Loperot-1 Well (denoted as LT-1 Well). The distinctive geological setting and physiographical features caused by tectonic rifting and block faulting, which affect sediment deposition and river drainage systems, match the surface and subsurface distribution of rock formations. The characteristics of identified subsurface strata showing oil and gas indications [1] augmented by geochemical analysis of the potential source rocks in terms of total amount of organic carbon (TOC) and temperature maximum (Tmax) present conducive environments and implications for the generation of hydrocarbons (Figs. 2, 3 and 4). |
|
Sedimentary rocks do not initially contain petroleum [2]. It is generated during burial and diagenesis of the organic matter (OM) they contain [3, 4]. In such intracontinental basins [5], like in the present case, the temperature gradient is often higher than the normal because of the process of formation of this basin [1]. It may sometimes reach a gradient of 30°C to 33°C/km. Higher temperatures are also reached by the co-precipitations of radioactive elements along the organic matter. It can been seen that the field of crude oil generation expands and reaches a maximum between 2 and 3km depth. In many cases where there is less generation of crude oil, there is still a possibility of finding gas. The most promising depths for gas, however, are beyond 2.8 km depth [1].
The LT–1 Well was drilled to a total depth of 2960m. This was not, however, the depth at which the basement was struck. Seismological data shows that the sedimentary section continues up to a depth of about 3500m. Of the four known types of kerogens, the present basin is expected to have either Type 1 or Type III, as the source of organic matter is lacustrine and fluvial [2]. Total organic carbon (TOC) is a measure of carbon present in a rock in the form of kerogen and bitumen. The organic matter is usually converted into kerogen and the type of kerogen depends upon the kind of OM that gets buried.
The section below examines some variations of some of the parameters like Total Organic Carbon (TOC) and Tmax (°C) in respect with depth in order to identify the possible presence of source rocks for hydrocarbons generation in the LT–1 Well (Lokichar Basin). For example, intracratonic basin like the one under study does not attract marine OM. The basin has had fluvial and lacustrine environments of deposition [1]. Therefore, the OM brought from the vegetation on the higher lands of the time (? Cretaceous and Early Tertiary) was buried along with the sediments in the mostly lacustrine and fluvial environments.
Materials and Methods
Selection of samples for TOC Analysis
Total organic carbon (TOC) is a measure of carbon present in a rock (not pecent) in the form of kerogen and bitumen. As mentioned in sections above, the LT–1 well, drilled in Lokichar basin, penetrated a depth of 2960m. The lithology established through drill core samples showed no substantial presence of carbonaceous strata beyond 2000m depths. Rock samples selected from 800 to 1800m depths, showing some indications of the presence of organic matter, were analysed using Rock-Eval technique.
|
 |
|
|
The section between 800m and 1800m depths was selected because of the reported oil shows and abundance of rocks with high gamma ray values. The aim was to measure the total amount of organic carbon (TOC) and identify the possible source rocks.
Methodology of TOC Analysis
The rock samples (about 1 gram) are first treated with hydrochloric acid - HCL (20% v/v) - to remove inorganic carbonates. The remaining acid is drained using a vacuum pump. The sample is washed with distilled water and dried in the oven at a constant temperature of about 40°C. The difference in weight before and after HCl treatment/reaction is recorded.
Once the system is started, it is left to run for one hour and calibrated for TOC/CO2. The dried sample is then analysed in a carbon determinator (IR–212) with an induction furnace and a control computer. Oxen gas (for burning the sample) and nitrogen gas (for pneutomatics-lifting of pedestal) are pressure-controlled at 35 pounds per square inch (psi). The combustion chamber pressure is also set between 11 and 12 psi.
The CO2 produced is passed through a carbon IR cell and its volume is recorded. The machine automatically records the corresponding TOC weight percent. Generally, TOC in shales, especially black shales, always exceed five times that from carbonates or other beds of sediments [6]. The organic matter in carbonates has more potential to generate hydrocarbons than those in shales. In the present case the LT–1 Well does not show presence of carbonates. The lithology is mostly clastics dominated by sandstones with shaley horizons.
Methodology of TOC Analysis
The selected samples are first treated with organic solvents (Chloroform, Dichloromethane, Menthol Acetone, etc) to remove bitumen. Bitumen content (TOC) also represents the oil content that can be dissolved from a rock. Subsequently, they are subjected to pyrolysis (Rock-Eval) after drying. The tried sample (~100 mg) is put inside a flame ionisation detector (FID) and is heated in a stream of helium at relatively low temperature (up to 300°C) for the first five minutes, in order to remove free or absorbed hydrocarbons (bitumen) that were present in the rock sample before pyrolysis (Fig. 2).
The analysis records two peaks, representing the volumes of two components of the organic matter (the volumes being proportional to the areas below the peaks). The expelled hydrocarbons, which usually volatilize below 300°C are represented by S1, which provides a measure of already generated hydrocarbons – bitumen [3].
|
|
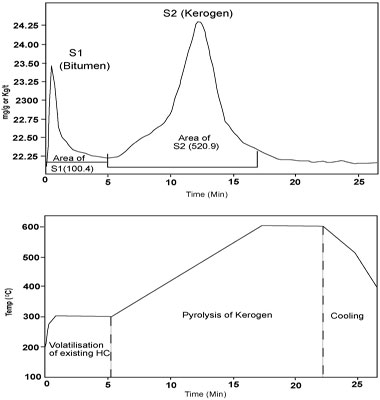
Fig. 2 Laboratory rock pyrolysis showing effect of heating an organic-rich sample at 1098m depth of LT-1 Well (Tmax 435.3°C)
There are not many samples, which give higher S1 values. Most of the samples showed S2 values only up to 20 kg/g and low S1 values (<0.3). The low S1 values show the paucity of hydrocarbons (bitumen) generated below 300°C. S2 values >10 kg/g are supposed to be more potential for hydrocarbons (kerogen) generation [1].
Results and Discussion
Recognition of Potential Source Rocks
On further heating the sample at the rate of 25°C per minute up to 600°C, the main pyrolytic thermal breakdown of kerogen occurs, and is represented by peak S2 (Fig. 2). The measure of the S2 area, produced at higher temperatures (550–600°C), decides the actual potential for generation of hydrocarbons by the sample. The area S2 is a measure of the remaining hydrocarbon generating ability of the organic matter. Oxygen–bearing volatile compounds (CO2 and H2O) are usually passed to a separate (thermal conductivity) detector, which produces S3 response. However, this procedure was not done in the case of LT–1 Well sample. The two areas of S1 and S2 are used to determine the maturation level of kerogen in the source rock. They are expressed in milligrams per gram of original rock (mg/g), or kilograms per ton (kg/ton). |
|
|
|
Rocks with S1 + S2 values < 2 kg/ton are not considered potential source rocks for hydrocarbon generation. Between 2 and 5 kg/ton a significant amount of petroleum may be generated but it would be too small to result in expulsion [1]. Source rocks with S1 + S2 values between 5 and 10 kg/ton have the potential to expel some portion of the generated oil. Only source rocks with values >10 kg/ton are considered rich for sufficient oil expulsion [6]. Thus, these rocks had the potential of oil generation as well as expulsion. The actual oil and gas generation can take place only when the threshold temperature (60°C) is reached. It also depends on the maturity level of kerogen, given by the temperature maximum (Tmax).
The Tmax at which the S2 generation peak occurs is also recorded in degree Celsius and is an indicator of source maturity (a function of the degree of maturation). Perhaps the temperature did not reach the threshold of 60°C considering the depth range of these samples. Or whatever hydrocarbon that was generated has been expelled and/or migrated [1]. For expulsion to occur the source rocks must get saturated first, a condition which is reached only on maturity of kerogen and temperature.
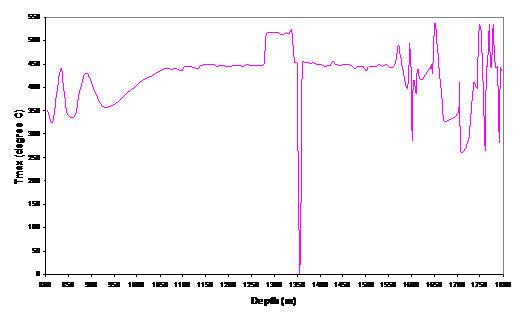
Temperature Maximum–Tmax (°C)
The temperature maximum (Tmax) mainly depends on maturation level of the organic matter (OM). As a general rule, Tmax (°C) increases with maturity of OM. Figure 3 gives the variation of Tmax with depth. It is seen that there are three peaks or regions (high) at 834m (437°C) and 888m (429°C); 1308m (518°C) and 1650m (537°C); 1749m (535°C) and 1770m (536°C). The highest values of Tmax are obtained only from samples at deeper levels but the variation is not uniform.
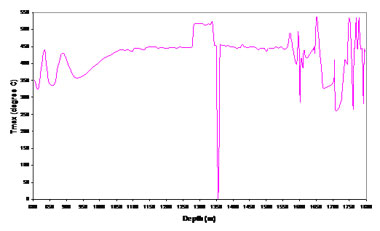
Fig. 3 Variations of Tmax with Depth
|
|
Achieving a level of maturity of kerogen (within the OM in the source rocks) is vital for petroleum exploration. With immature kerogen no petroleum is generated but with increasing maturity, first oil and then gas is expected to be generated. Tmax being an indicator of the maturity, the higher the Tmax the higher would be the degree of maturity. It is also to be considered that more complex kerogen require higher temperatures for breaking.
Figure 3 shows that maximum number of samples between 1250m and 1800 fall within the range of Tmax 445°C and 537°C. From 1062m to 1578m depths the Tmax shows a characteristics stable range of 445 – 450°C with a slight variation towards higher side between 1278 – 1350m and a sudden very low value at 1356m depth, but from 1590-1800m the Tmax shows very frequent variations as high as 537°C at 1650m depth and as low as 263°C at 1707m depth.
These two levels are also characterised by the gamma rays values. The upper one has higher gamma ray range (>75 API units) while the deeper one has lower gamma ray range (60-75 API units). The similarity between the production index (PI) and Tmax curves in this depth range is indicative of a kind of difference between the hydrocarbon type (bitumen or kerogen) on one side, and a difference in the temperature that can be attained [1].
The kind of kerogen that shows lower Tmax range is simpler type (maybe Type I) while those samples in the 1600m to 1800m depths range had more complex type of kerogen (maybe Type III). The kerogen breakdown depends not only on the temperatures attained but also on the time which it gets for the breakdown, given sufficient time and temperatures in the range of 100-150°C kerogen breakdown is facilitated. The more complex kerogen, however, takes higher temperature and greater time for the cracking process. The time perception, of course, is in the range of thousands of years or even millions of years.
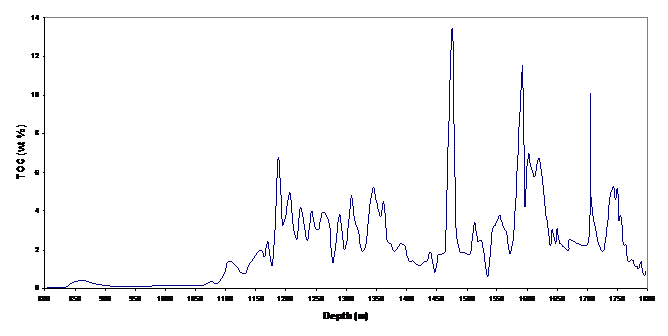
In the LT-1 Well, oil and gas shows were encountered at depths between 800-1000m and 1400-1600m. The first level is above the sequence showing moderate TOC values (Fig. 4). The TOC value of 0.5% is frequently taken as the maximum organic content for a source rock. Below this is not enough hydrocarbons can possibly be generated to saturate the source rock.
The second level of oil shows is within depth range of samples showing uniform Tmax and higher TOC. A normal geothermal gradient will lead to the threshold temperatures of 60-65°C at depth of about 1800m. Therefore it is expected that the kerogen type at the deeper depths in the present case, which represents the frequently maximum ranges of Tmax was the principal level for oil formation. Most of the oil and gas shows in the LT-1 Well are above this level and are within rocks with suitable porosity [1].
|
|
|
|
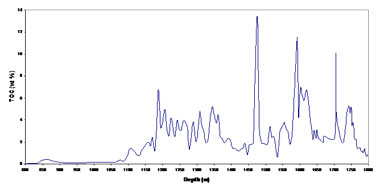
Fig. 4 Variations between TOC and Depth
Paleogeograhic Position
The paleogeographic position of this region (what is presently northern Kenya) was much to the south of the Equator during the Triassic and Jurassic/Cretaceous time [7]. Luxuriant vegetation on land, swampy grounds, humid climate and good rainfall were some of the then prevailing environmental conditions. With such a source, the organic matter (OM) that got buried could only generate the Type I or Type III kerogen whose initial product could be waxy crude or gas [3].
The analysis helped in determining the proportion and frequency of shale horizons within the otherwise sandy sections, as well as the variations in grain size within the sandstone beds. Speedy sedimentation along with basin subsidence prevents the oxidation of organic matter and preserves it for possible hydrocarbon generation [1].
Conclusion
The source rocks characterisation of Well LT-1, identified above, belonged to Oligocene to Lower Miocene age. These source rocks range from depths 800–1797m. However, the interval section which proved to have effective source rocks with sufficient organic matter (OM) that could generate potential oil and gas, is considered to be at depths 1650–1800m (considering the normal temperatures gradients).
Intracratonic basins of these types are poor prospects for the hydrocarbon exploration, but they contain adequate potential reservoir rocks, which can trap whatever hydrocarbons that were generated by the chiefly continental organic matter buried with the sediments. There are a few examples (1.5 percent of world’s proven reserves) of hydrocarbon generating intracratonic basins of this type.
The examined salient structural features containing source rocks, reservoir rocks and seals in the oil/gas-bearing strata based on gravity, seismic and gamma ray profiles, and other sedimentological parameters helped in characterizing possible future prognostic targets and their implications for hydrocarbons prospecting and exploration in the northwest Kenya rift basins. |
|
Acknowledgements
This paper is published with the permission of the Managing Director, National Oil Corporation of Kenya. The fieldwork, data analyses and interpretation formed part of my Ph.D. research-related thesis work, under the guidance of Prof. A.M. Patwardhan, formerly Professor of Geology and Head, University of Pune, whom I thank for his invaluable comments and discussions during my research period.
References
[1] B.K. Rop, Subsurface stratigraphical studies of Cretaceous-Tertiary basins of northwest Kenya, Ph.D. Thesis, University of Pune, (2003), 174 p.
[2] F.K. North, Petroleum Geology. Boston Unwin Hyman Publishers (1985), 631p.
[3] C. Barker, Petroleum Geochemistry in exploration and development: Part 1-Principles and processes. The Leading Edge, Vol. 18 (1999), pp. 678-684.
[4] B.P. Tissot and D.H. Welte, Petroleum Formation and Occurrence, Second Revised and Enlarged Edition (1984), Springer-Verlag Berlin Heidelberg New York Tokyo, 699p.
[5] C.R. Selly, Elements of Petroleum Geology, W.H. Freeman and Co. New York (1985), 449p.
[6] A.A. Allen and J.R. Allen, Basin Analysis: Principles and Applications. Blackwell Scientific Publications, Oxford London Edinburgh (1990), 451p.
[7] A.L. Bloom, Geomorphology, Third Edition (2002), Prentice-Hall India Pvt. Ltd., New Delhi, 482p.
|
|
Possibly Related Forum Topics
|
|
|
|
|